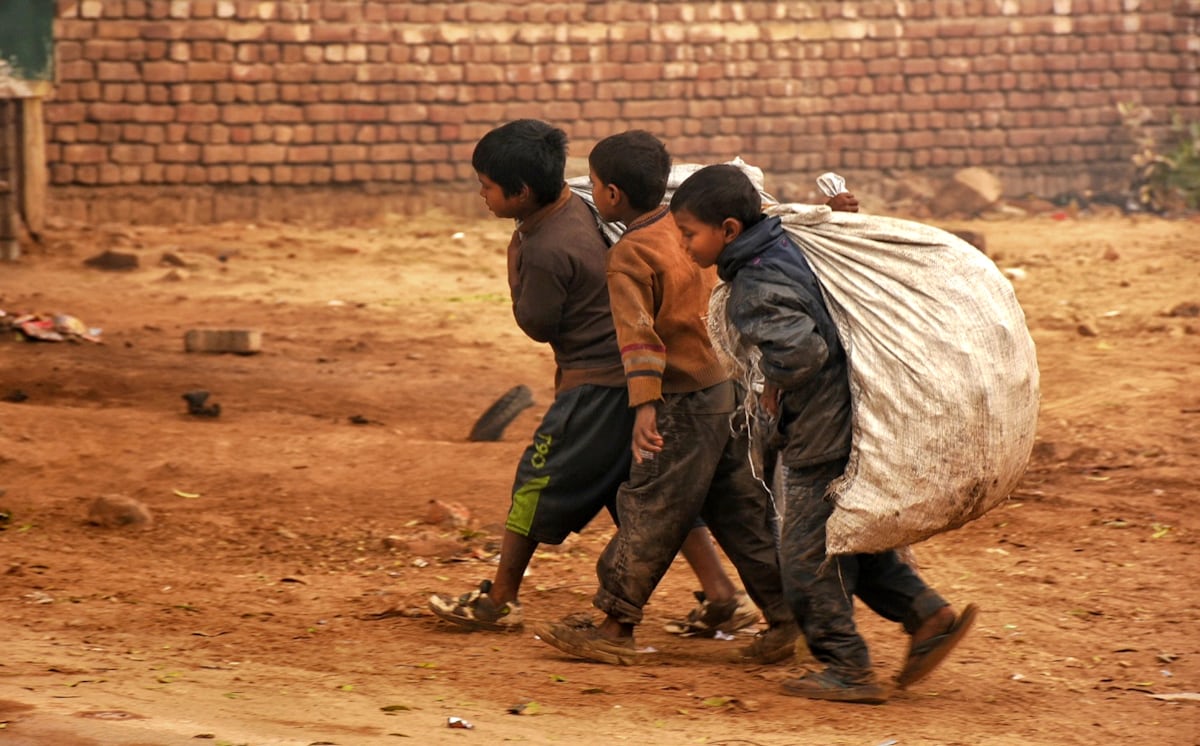
Sometimes, “more equal” means “similarly struggling”. Or, we can just say, when everyone is equally poor, the data calls it “equal”.
Reason why, the Gini Coefficient which measures inequality, does not always reflect the true picture.
The Gini coefficient ranges from 0 to 1 – where 0 means perfect equality ( everyone earns the same) and 1 means perfect inequality ( one person earns everything). While useful, but as mentioned above, it does not always show the real picture.
Take a simple example. In a country like India, many people earn similarly low incomes, with a small rich group. This creates a compressed distribution at the bottom, which can result in a lower Gini.
In contrast, countries like the United States or Japan have a wider spread of incomes, including a large middle class, which can increase the Gini.
So, a country may appear “more equal” simply because many people are uniformly poor. The Gini measures distribution, not prosperity, opportunity, or quality of life – making it an incomplete indicator of true inequality.
We need to go beyond Gini to understand the real face of inequality.
Equality in data is not the same as equality in life.
#Inequality #GiniCoefficient #InclusiveGrowth #PovertyReduction #EconomicPolicy